If you’re running kube-prometheus-stack and ArgoCD but not monitoring your GitOps pipeline, you’re missing critical visibility into sync performance, app health trends, and controller resource usage. Here’s how to enable comprehensive ArgoCD monitoring in under 10 minutes.
What You’ll Get
- Prometheus metrics for all ArgoCD components
- Pre-built Grafana dashboard for sync performance and app health
- Service monitor auto-discovery by Prometheus Operator
- Real-time alerts for application sync failures
Enable ArgoCD Metrics and Service Monitors
Update your ArgoCD Helm values to enable metrics for each component. Add this configuration to the components you want to monitor:
server:
  metrics:
    enabled: true
    serviceMonitor:
      enabled: true
      additionalLabels:
        release: kube-prometheus-stack

controller:
  metrics:
    enabled: true
    serviceMonitor:
      enabled: true
      additionalLabels:
        release: kube-prometheus-stack

repoServer:
  metrics:
    enabled: true
    serviceMonitor:
      enabled: true
      additionalLabels:
        release: kube-prometheus-stack

applicationSet:
  metrics:
    enabled: true
    serviceMonitor:
      enabled: true
      additionalLabels:
        release: kube-prometheus-stack
Critical Configuration Notes
Label Matching: The release: kube-prometheus-stack label must match your Prometheus Operator’s service monitor selector. If you used a different release name during installation, adjust accordingly.
Component Coverage: Enable metrics for all ArgoCD components you care about - controller, server, repoServer, and applicationSet. Missing even one component creates blind spots in your monitoring.
Add the Grafana Dashboard
Configure Grafana to automatically load the ArgoCD dashboard:
grafana:
  dashboards:
    default:
      argocd:
        url: https://raw.githubusercontent.com/argoproj/argo-cd/master/examples/dashboard.json
        token: ""
        curlOptions: "-sLf"

  dashboardProviders:
    dashboardproviders.yaml:
      apiVersion: 1
      providers:
      - name: "default"
        orgId: 1
        folder: ""
        type: file
        disableDeletion: false
        editable: true
        options:
          path: /var/lib/grafana/dashboards/default
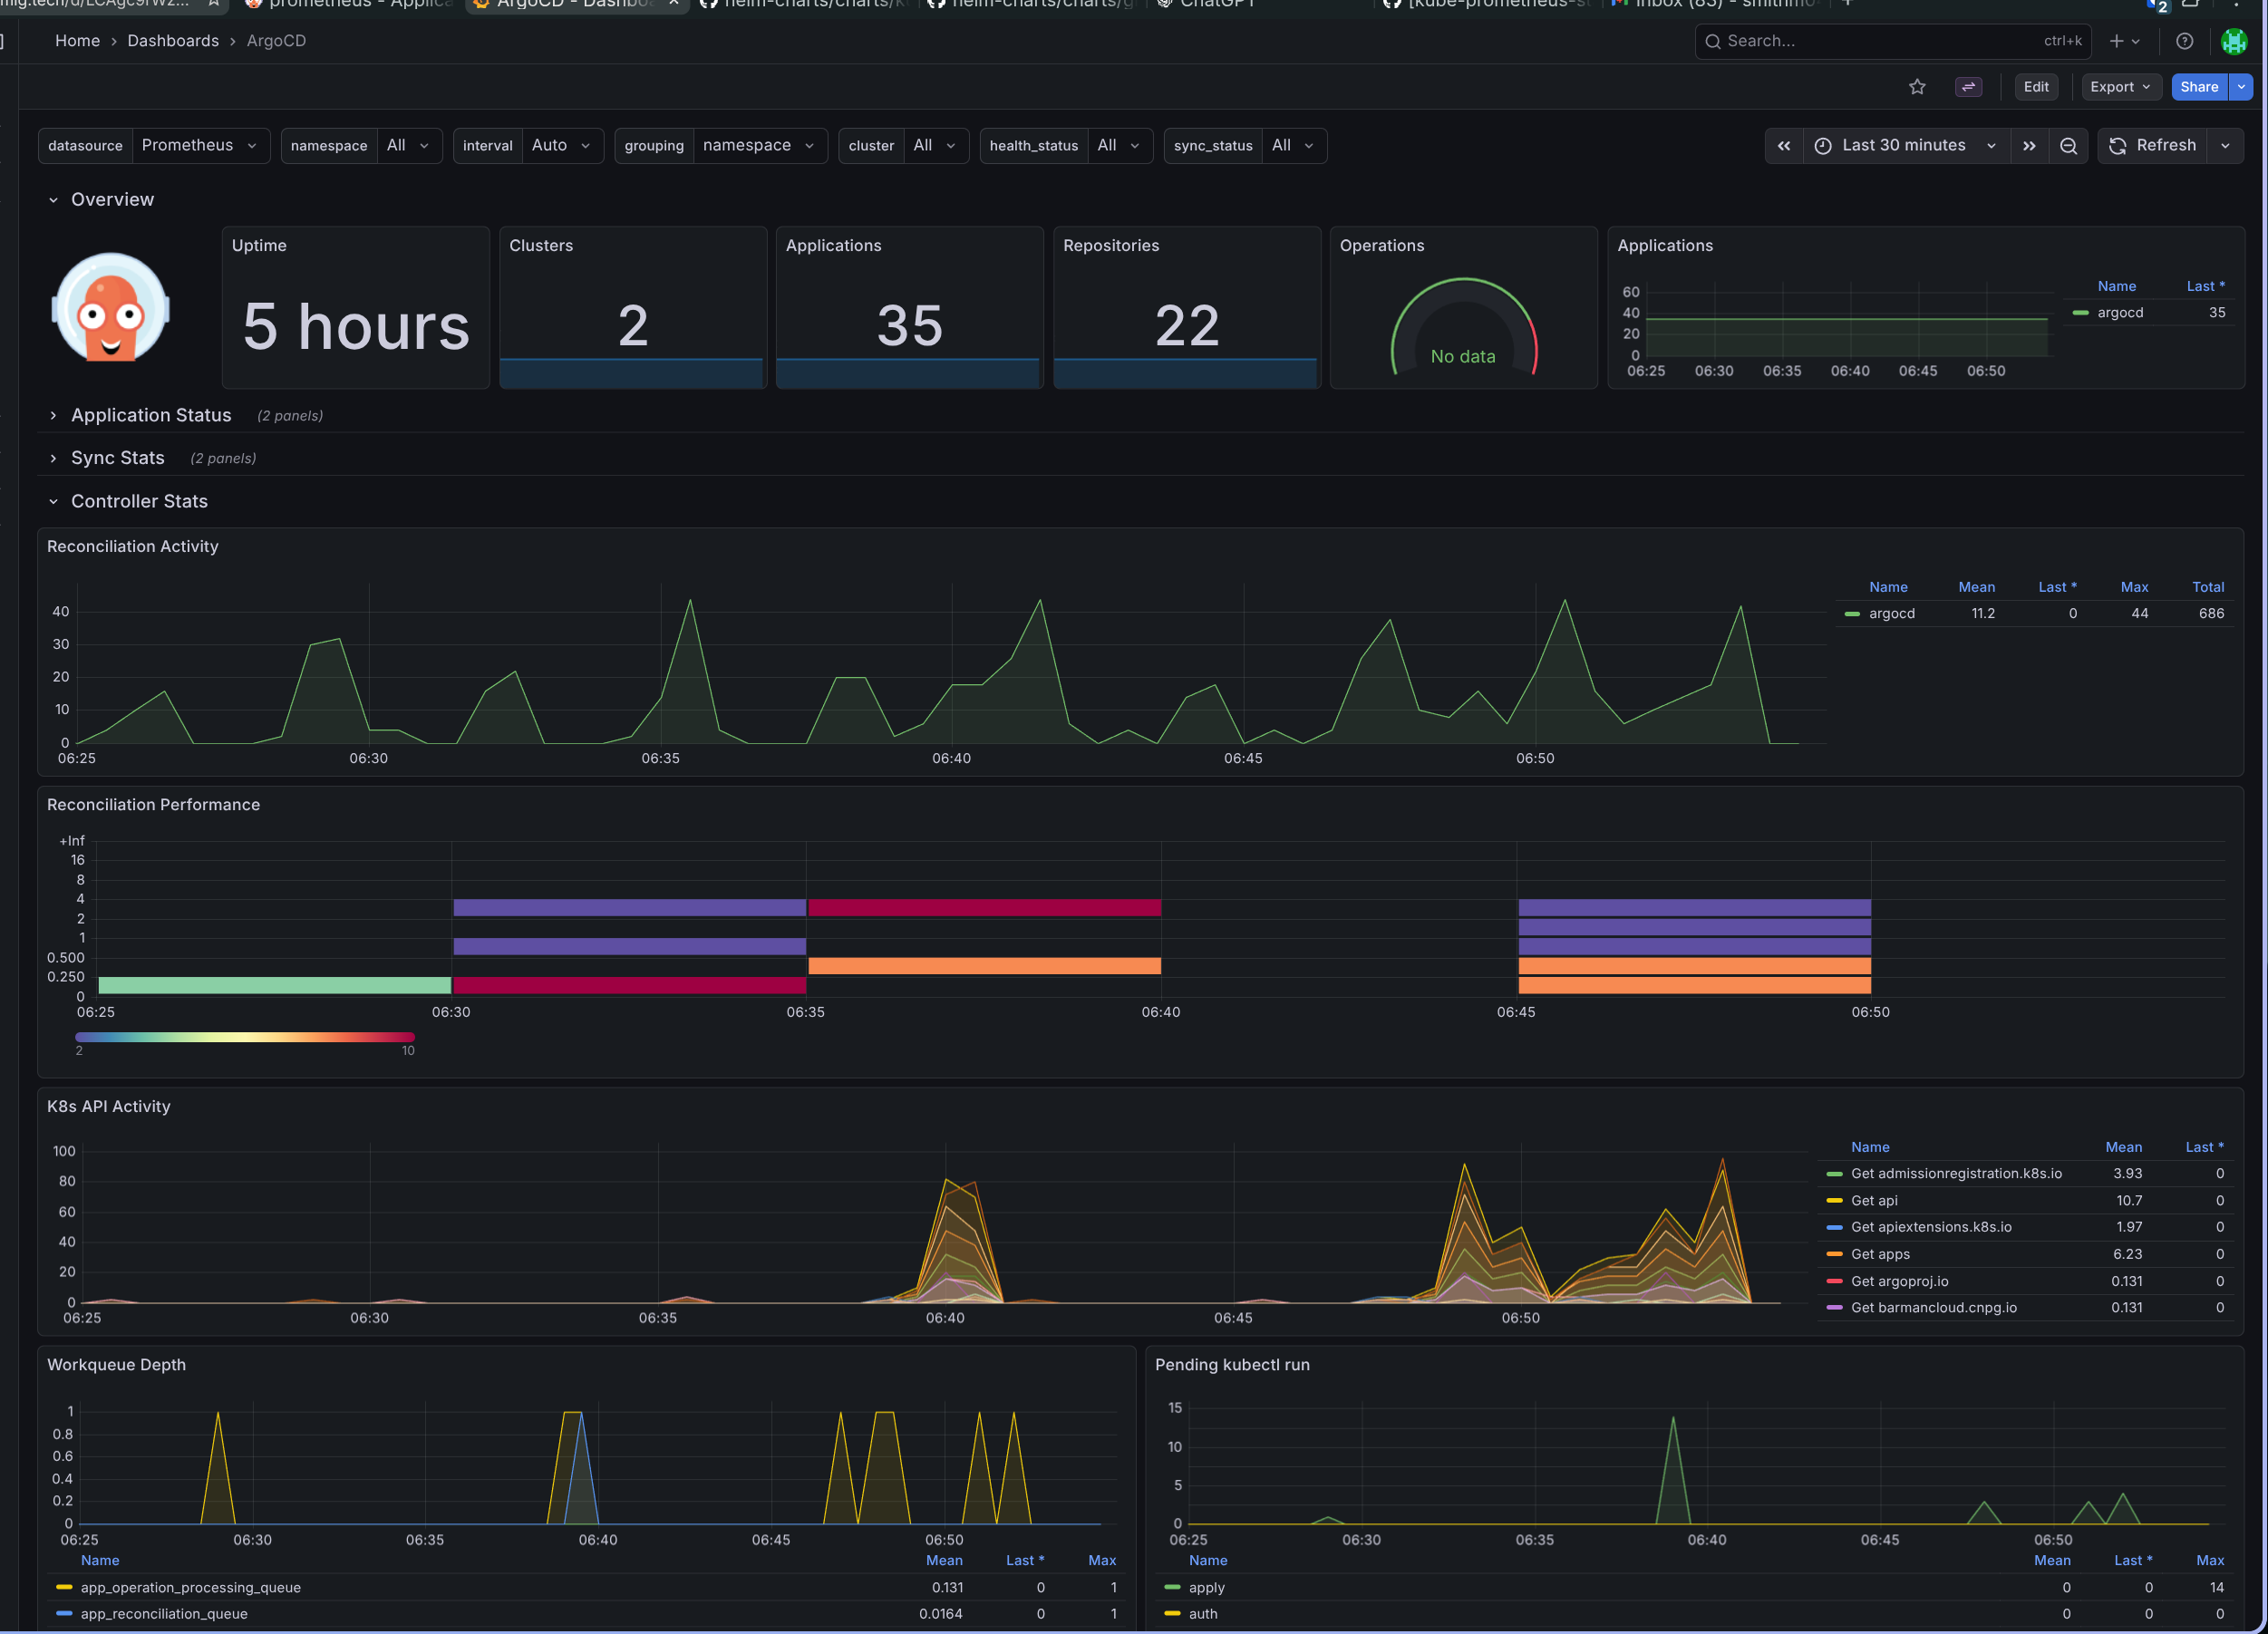
What the Dashboard Provides
The ArgoCD Grafana dashboard gives you immediate visibility into:
- Sync operation performance and duration trends
- Application health status across your entire cluster
- Controller resource utilization (CPU, memory)
- Repository connection health
- API request rates and latency
This is especially valuable when troubleshooting slow syncs or investigating why applications are degraded. Rather than checking the ArgoCD UI repeatedly, you get proactive monitoring and historical trends.
Verification
After applying your Helm changes, verify the service monitors were created:
kubectl get servicemonitor -n argocd
Check that Prometheus is scraping the targets:
kubectl port-forward -n monitoring svc/kube-prometheus-stack-prometheus 9090:9090
# Navigate to http://localhost:9090/targets
Access the Grafana dashboard to confirm metrics are flowing.
Key Takeaway
Monitoring your GitOps pipeline shouldn’t be an afterthought. With these configurations, you gain complete visibility into ArgoCD’s performance and health, enabling you to catch issues before they impact deployments.